> ## Documentation Index
> Fetch the complete documentation index at: https://docs.fabi.ai/llms.txt
> Use this file to discover all available pages before exploring further.
# Quick Start
> Get started with Fabi.ai in minutes. Learn how to upload data, ask questions, and create your first dashboard.
Welcome to Fabi.ai! This guide will walk you through the essentials to get you analyzing data and building dashboards in just a few minutes.
## Step 1: Create your account
First, create your Fabi.ai account:
1. Navigate to [https://app.fabi.ai/](https://app.fabi.ai/)
2. Click **Sign in with Google** and log in
**Pro tip:** Use your corporate email address to unlock collaboration features and work seamlessly with your team.
## Step 2: Get your data into Fabi
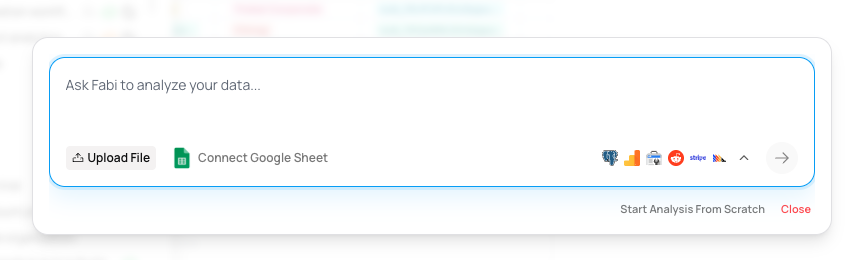
The fastest way to start analyzing is to either **upload a file** or **connect a Google Sheet**.
### Upload a file
Fabi.ai supports CSV, Excel, Parquet, and JSON files. Simply:
1. From the landing page, click **Start analyzing a file**
2. Select your file and upload it
Fabi.ai stores your data in DuckDB, so you can analyze large files without performance issues.
 ### Connect a Google Sheet
Alternatively, you can connect directly to Google Sheets:
1. Click **Connect data source**
2. Select **Google Sheets**
3. Authenticate and choose your sheet
For more data sources like databases and warehouses, check out our [Connecting data sources](connect_data_sources) page.
## Step 3: Ask the AI questions
Now comes the fun part! Using AI for data analysis with Fabi is as simple as asking a question in plain English.
### Connect a Google Sheet
Alternatively, you can connect directly to Google Sheets:
1. Click **Connect data source**
2. Select **Google Sheets**
3. Authenticate and choose your sheet
For more data sources like databases and warehouses, check out our [Connecting data sources](connect_data_sources) page.
## Step 3: Ask the AI questions
Now comes the fun part! Using AI for data analysis with Fabi is as simple as asking a question in plain English.
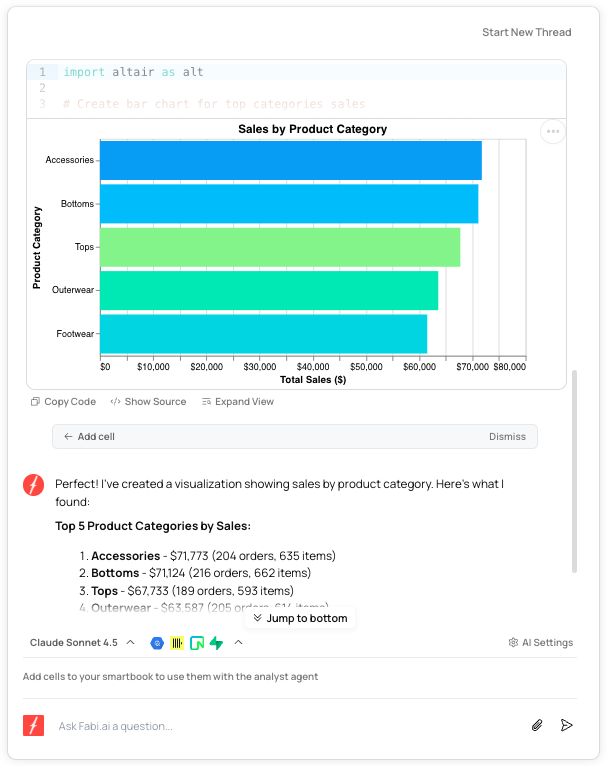 The AI will:
* Automatically write SQL or Python code
* Generate charts and visualizations
* Analyze trends and insights
* Handle follow-up questions
**Example questions you can ask:**
* "What are the top 10 products by revenue?"
* "Show me monthly sales trends as a line chart"
* "Which customers have the highest lifetime value?"
* "Create a breakdown of revenue by region"
You can reference specific data elements using @ to tag them in your questions.
## Step 4: Save results to your Smartbook
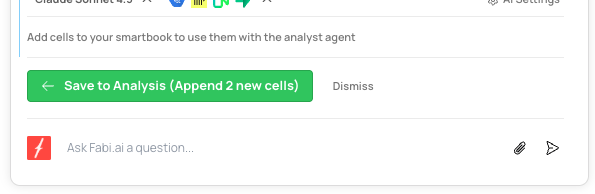
When the AI generates insights you want to keep:
1. Review the AI's suggestion (table, chart, or analysis)
2. Click **Save** to add it to your Smartbook
Each saved element becomes a block in your Smartbook - think of it as your interactive analysis workspace where tables, charts, and code cells come together.
The AI will:
* Automatically write SQL or Python code
* Generate charts and visualizations
* Analyze trends and insights
* Handle follow-up questions
**Example questions you can ask:**
* "What are the top 10 products by revenue?"
* "Show me monthly sales trends as a line chart"
* "Which customers have the highest lifetime value?"
* "Create a breakdown of revenue by region"
You can reference specific data elements using @ to tag them in your questions.
## Step 4: Save results to your Smartbook
When the AI generates insights you want to keep:
1. Review the AI's suggestion (table, chart, or analysis)
2. Click **Save** to add it to your Smartbook
Each saved element becomes a block in your Smartbook - think of it as your interactive analysis workspace where tables, charts, and code cells come together.
 ## Step 5: Publish as a dashboard
Ready to share your work? Turn your Smartbook into a polished dashboard:
1. Click **Build Dashboard** in the top navigation
2. Your saved blocks are automatically formatted into a shareable dashboard
3. Customize the layout if needed
4. Share with your team or publish it
## Step 5: Publish as a dashboard
Ready to share your work? Turn your Smartbook into a polished dashboard:
1. Click **Build Dashboard** in the top navigation
2. Your saved blocks are automatically formatted into a shareable dashboard
3. Customize the layout if needed
4. Share with your team or publish it
 Dashboards can be scheduled to update automatically and shared with your team for real-time collaboration.
## What's next?
Now that you've created your first analysis and dashboard, explore more advanced features:
Master advanced AI techniques for deeper analysis
Schedule dashboards and automate data pipelines
Connect to Snowflake, BigQuery, PostgreSQL, and more
Use our embedded AI agent for advanced analysis
Dashboards can be scheduled to update automatically and shared with your team for real-time collaboration.
## What's next?
Now that you've created your first analysis and dashboard, explore more advanced features:
Master advanced AI techniques for deeper analysis
Schedule dashboards and automate data pipelines
Connect to Snowflake, BigQuery, PostgreSQL, and more
Use our embedded AI agent for advanced analysis