Overview
If you’re doing an analysis for a stakeholder that lives in spreadsheets (FP&A, we’re looking at you), when you share a Dashboard or data app with them, there’s a good chance that the first thing they do is export the data. We want you to be able to meet your stakeholders where they are. With the push-to-Google Sheets functionality, you can do your entire analysis within Fabi.ai (or even build complex prediction models) and push that data to a live Google Sheets dashboard in just a few clicks. This is also useful functionality if you or your team need to provide regular executive reports in Google Slides and don’t want to deal with the tedious task of copy/pasting data on a weekly basis.Preparing the DataFrame
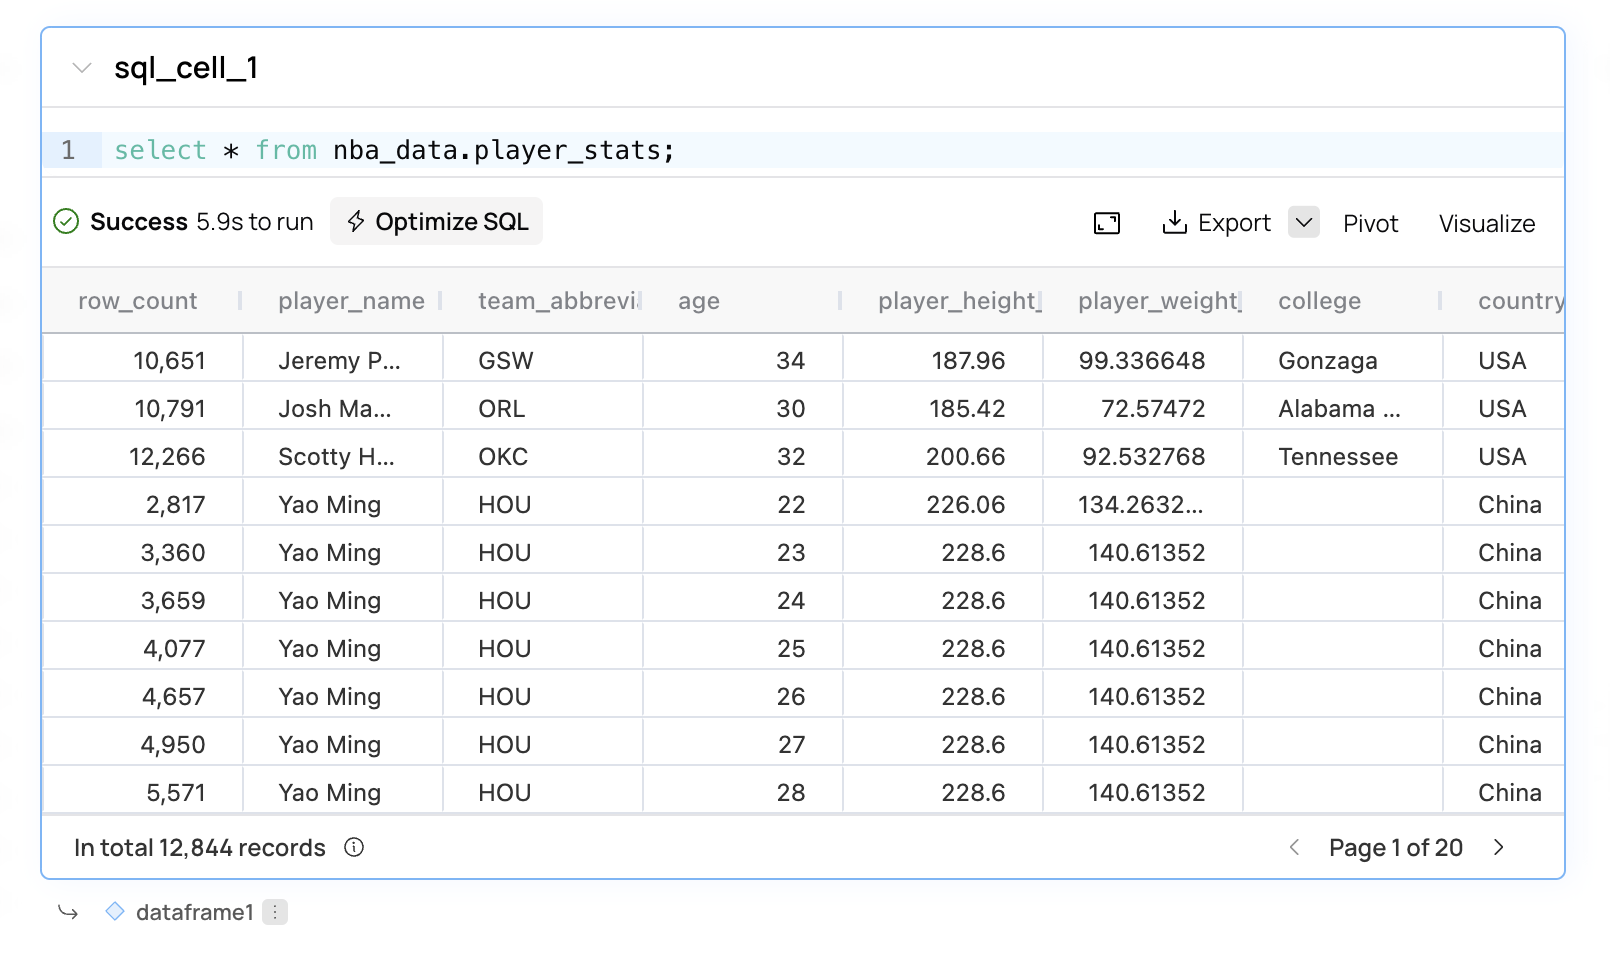
Start by creating your Python DataFrame. You can simply write a SQL query using a SQL cell, which will automatically generate a DataFrame as shown in the following screenshot withdataframe1:
Configuring Google Sheets
Once you’ve created your DataFrame, add a new Google Sheets Push cell to your Smartbook or workflow.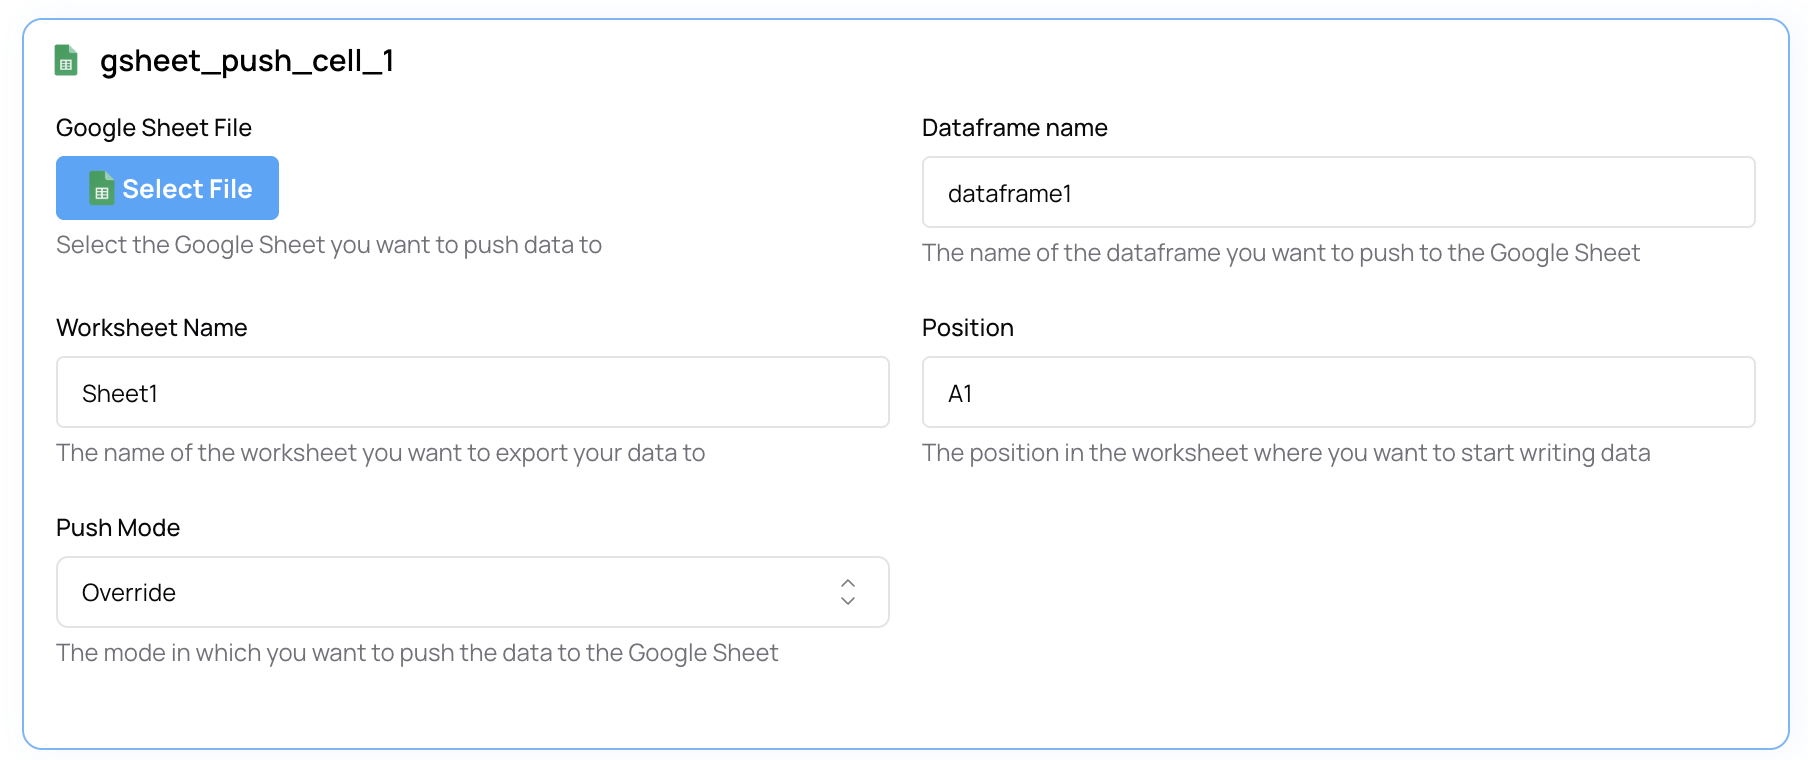
- Sheet URL: The URL of the Google Sheet you want to push data to
- Worksheet Name: The name of the sheet you’re pushing the data to
- Push Mode: Whether you want to override the existing spreadsheet on every update or create a new sheet